Create a way to display sustainability data that builds user trust in the brand.
A case study through the University of Wisconsin-Madison. I am not affiliated with Patagonia
My Role
UX Researcher
UX Designer
Tools
Figma
Photoshop
Google Drive
Platform
Responsive Website
Introduction
Customers are skeptical of companies who claim to be sustainable due to other companies lying about their sustainability practices. I set out to create a way for sustainable companies to display their sustainability data in a way that increases trust between users and the brand. By leveraging the comprehensive sustainability data that Patagonia provides on its website, I developed a straightforward and efficient method for businesses to present their own sustainability data. This approach, informed by user research, enhances user confidence and trust in the displayed information.
My Role
UX Researcher
Exploratory Research
User Interviews
Survey Creation and Analysis
Persona
Empathy Map
Usability Testing
UX Designer
Product Ideation
Product Flow
Mid and Hi-fi Prototype creation in Figma
UI Designer
Developed layout of components
Created components in Figma
Selected colors for components
Problem
Companies are lying about their sustainability initiatives, hurting consumer trust in companies that are actually doing sustainability work.
If a consumer believes a company is lying, it can lead to mistrust in the brand, less brand engagement, and a decrease in purchasing intention.
Goal
Find what specific information about environmental sustainability a company can show, in order to increase the trust the consumer has in the company.
In order to answer this question, I needed to know what specific elements of climate-conscious marketing are and what do users think/feel about them.
Design a way to display effective sustainability data that builds user trust in brand.
Research
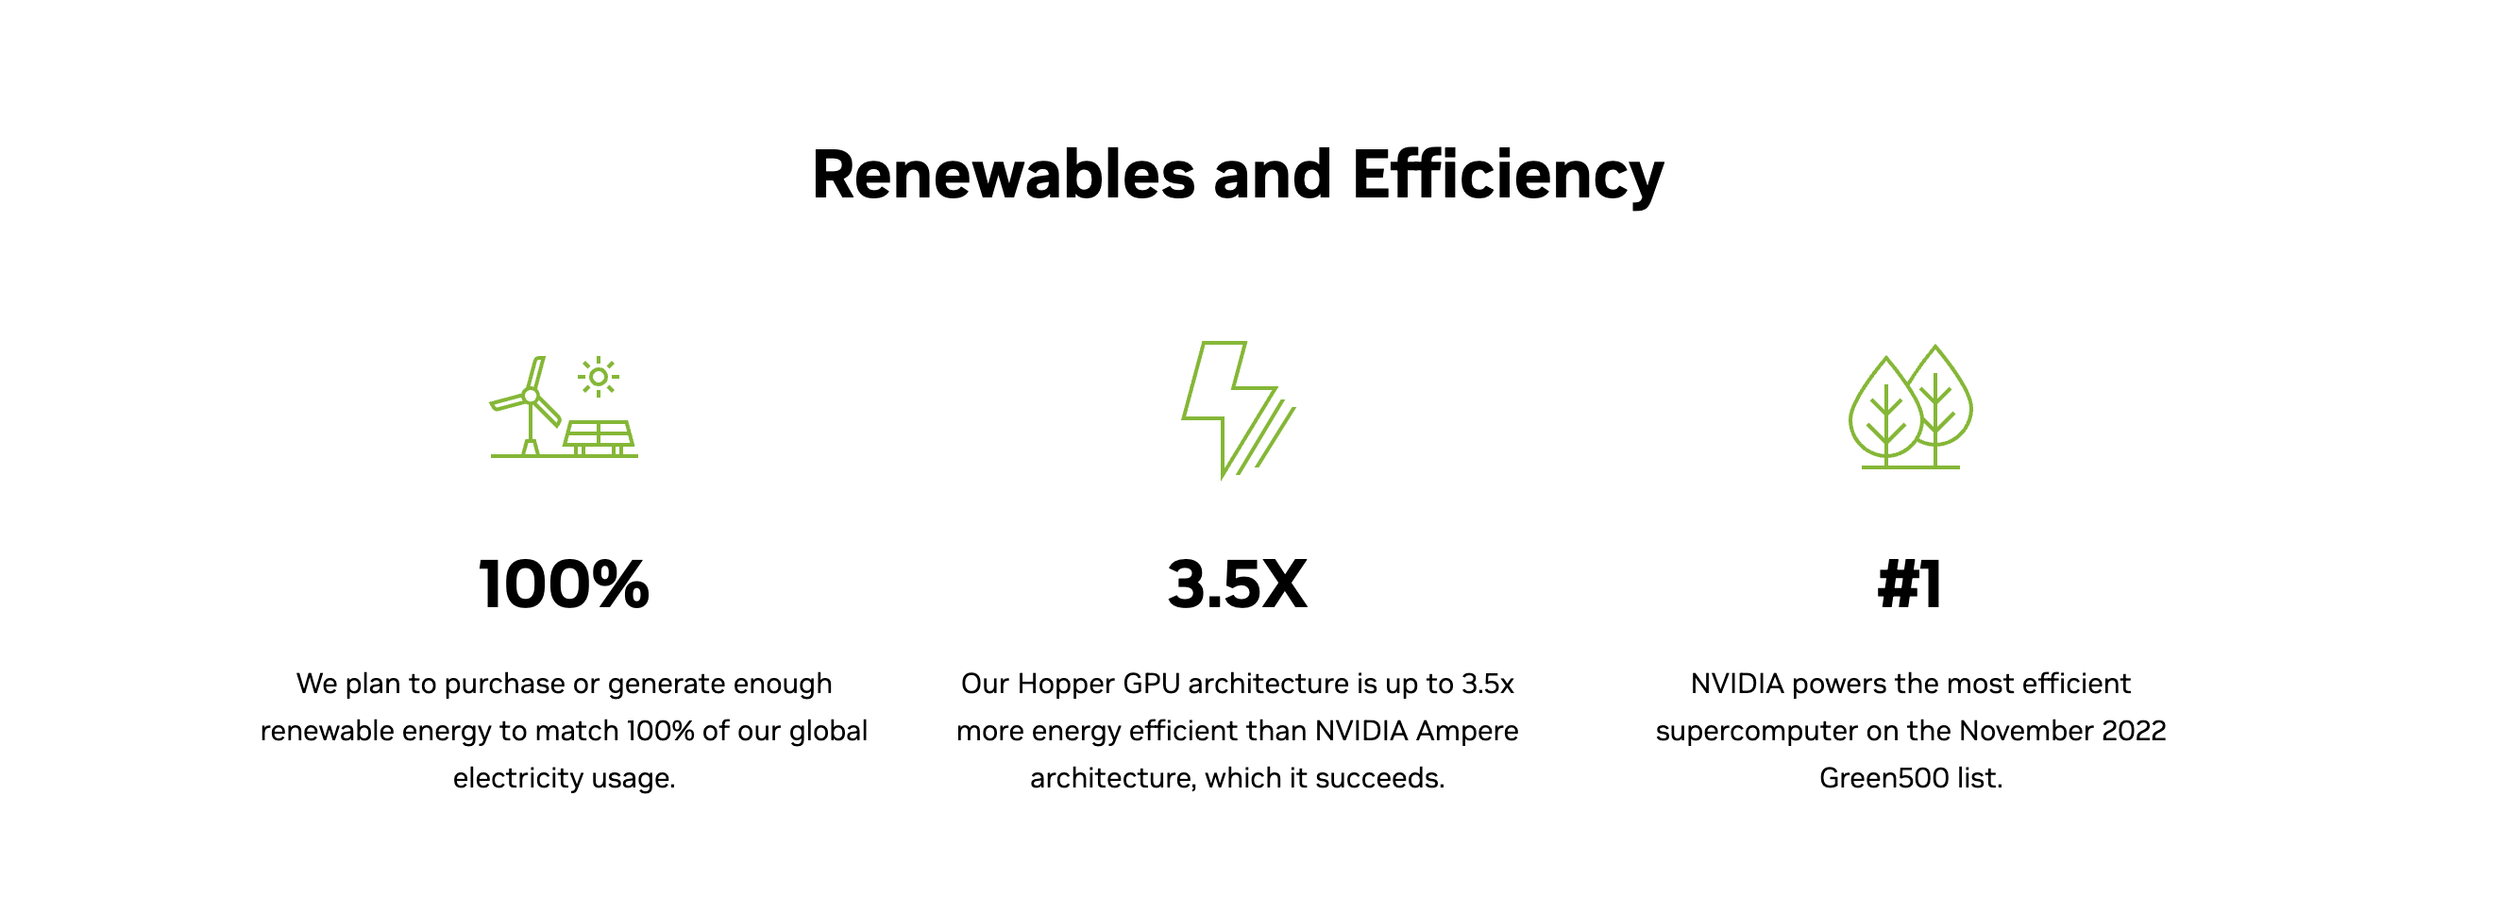
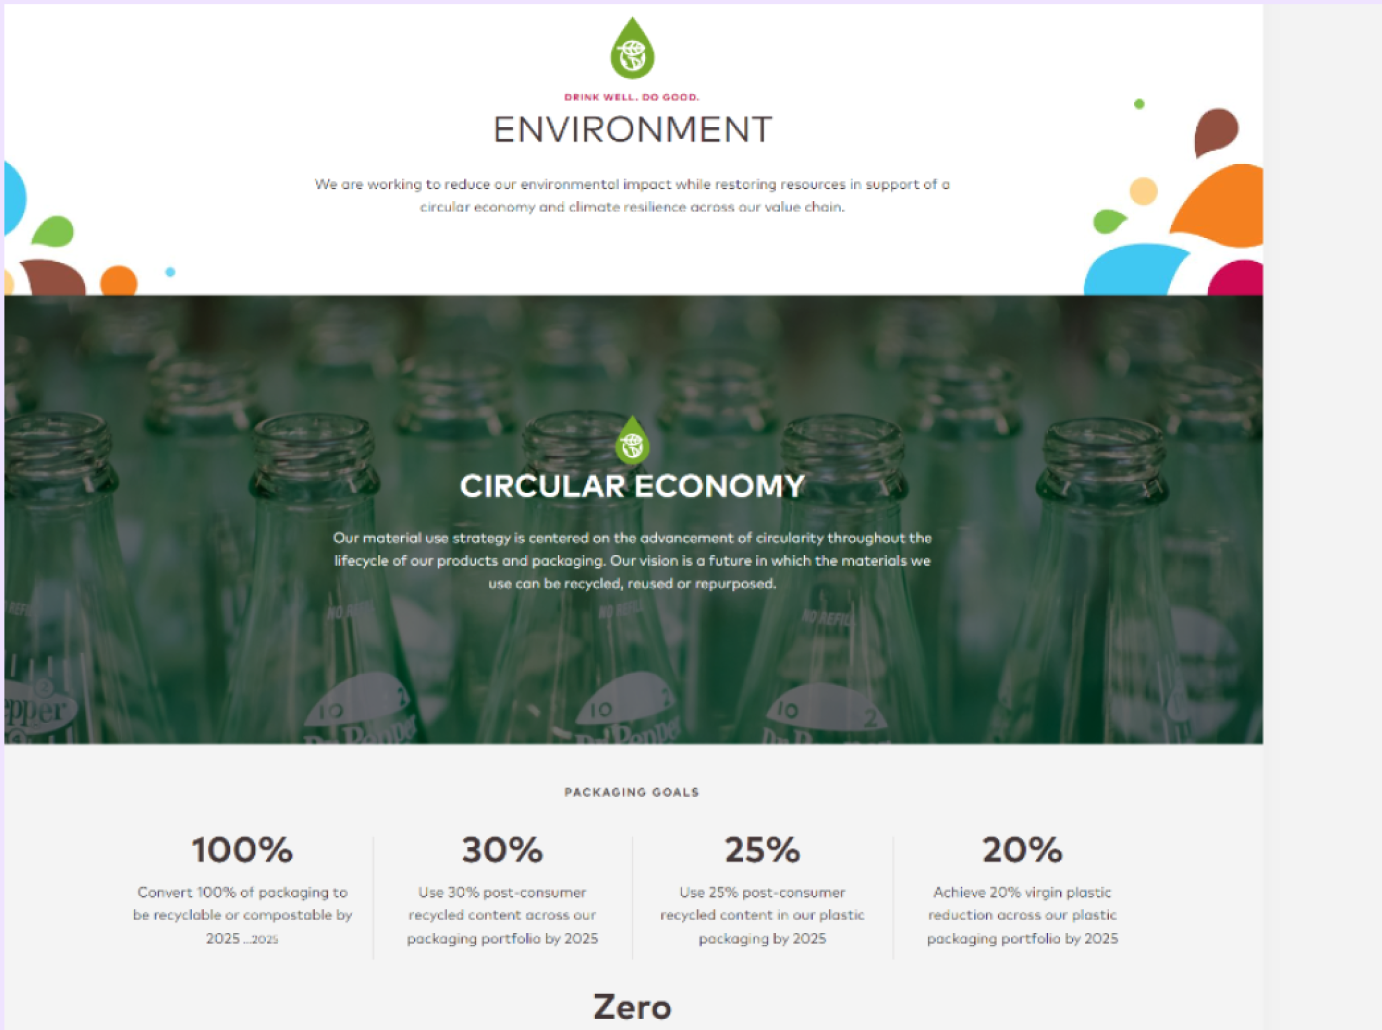
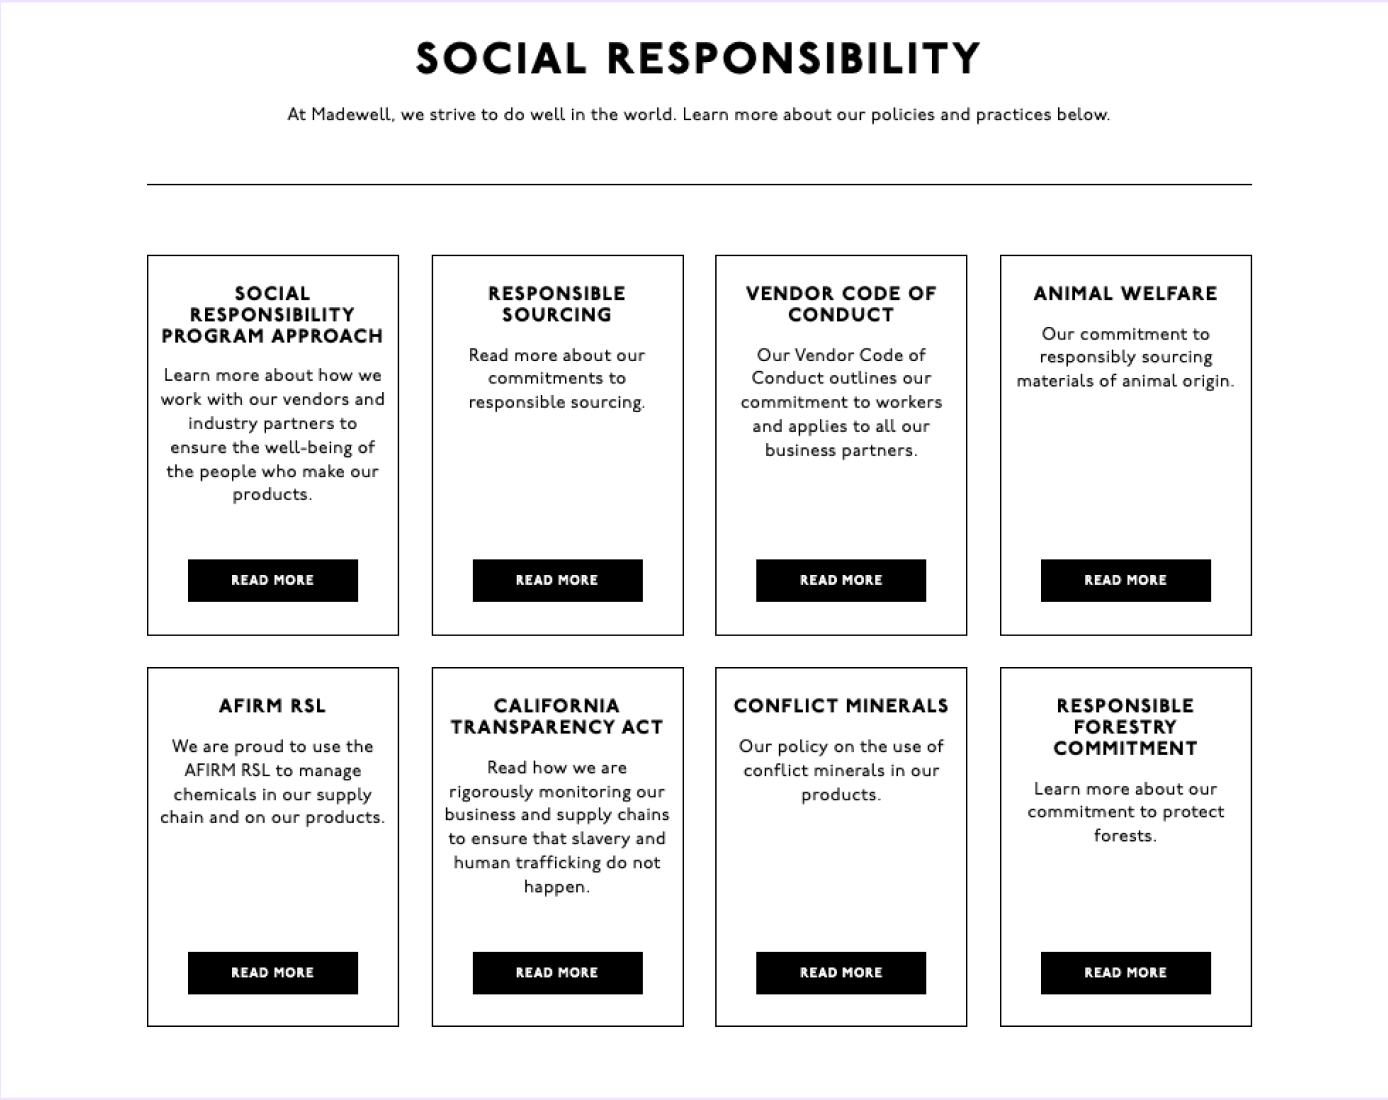
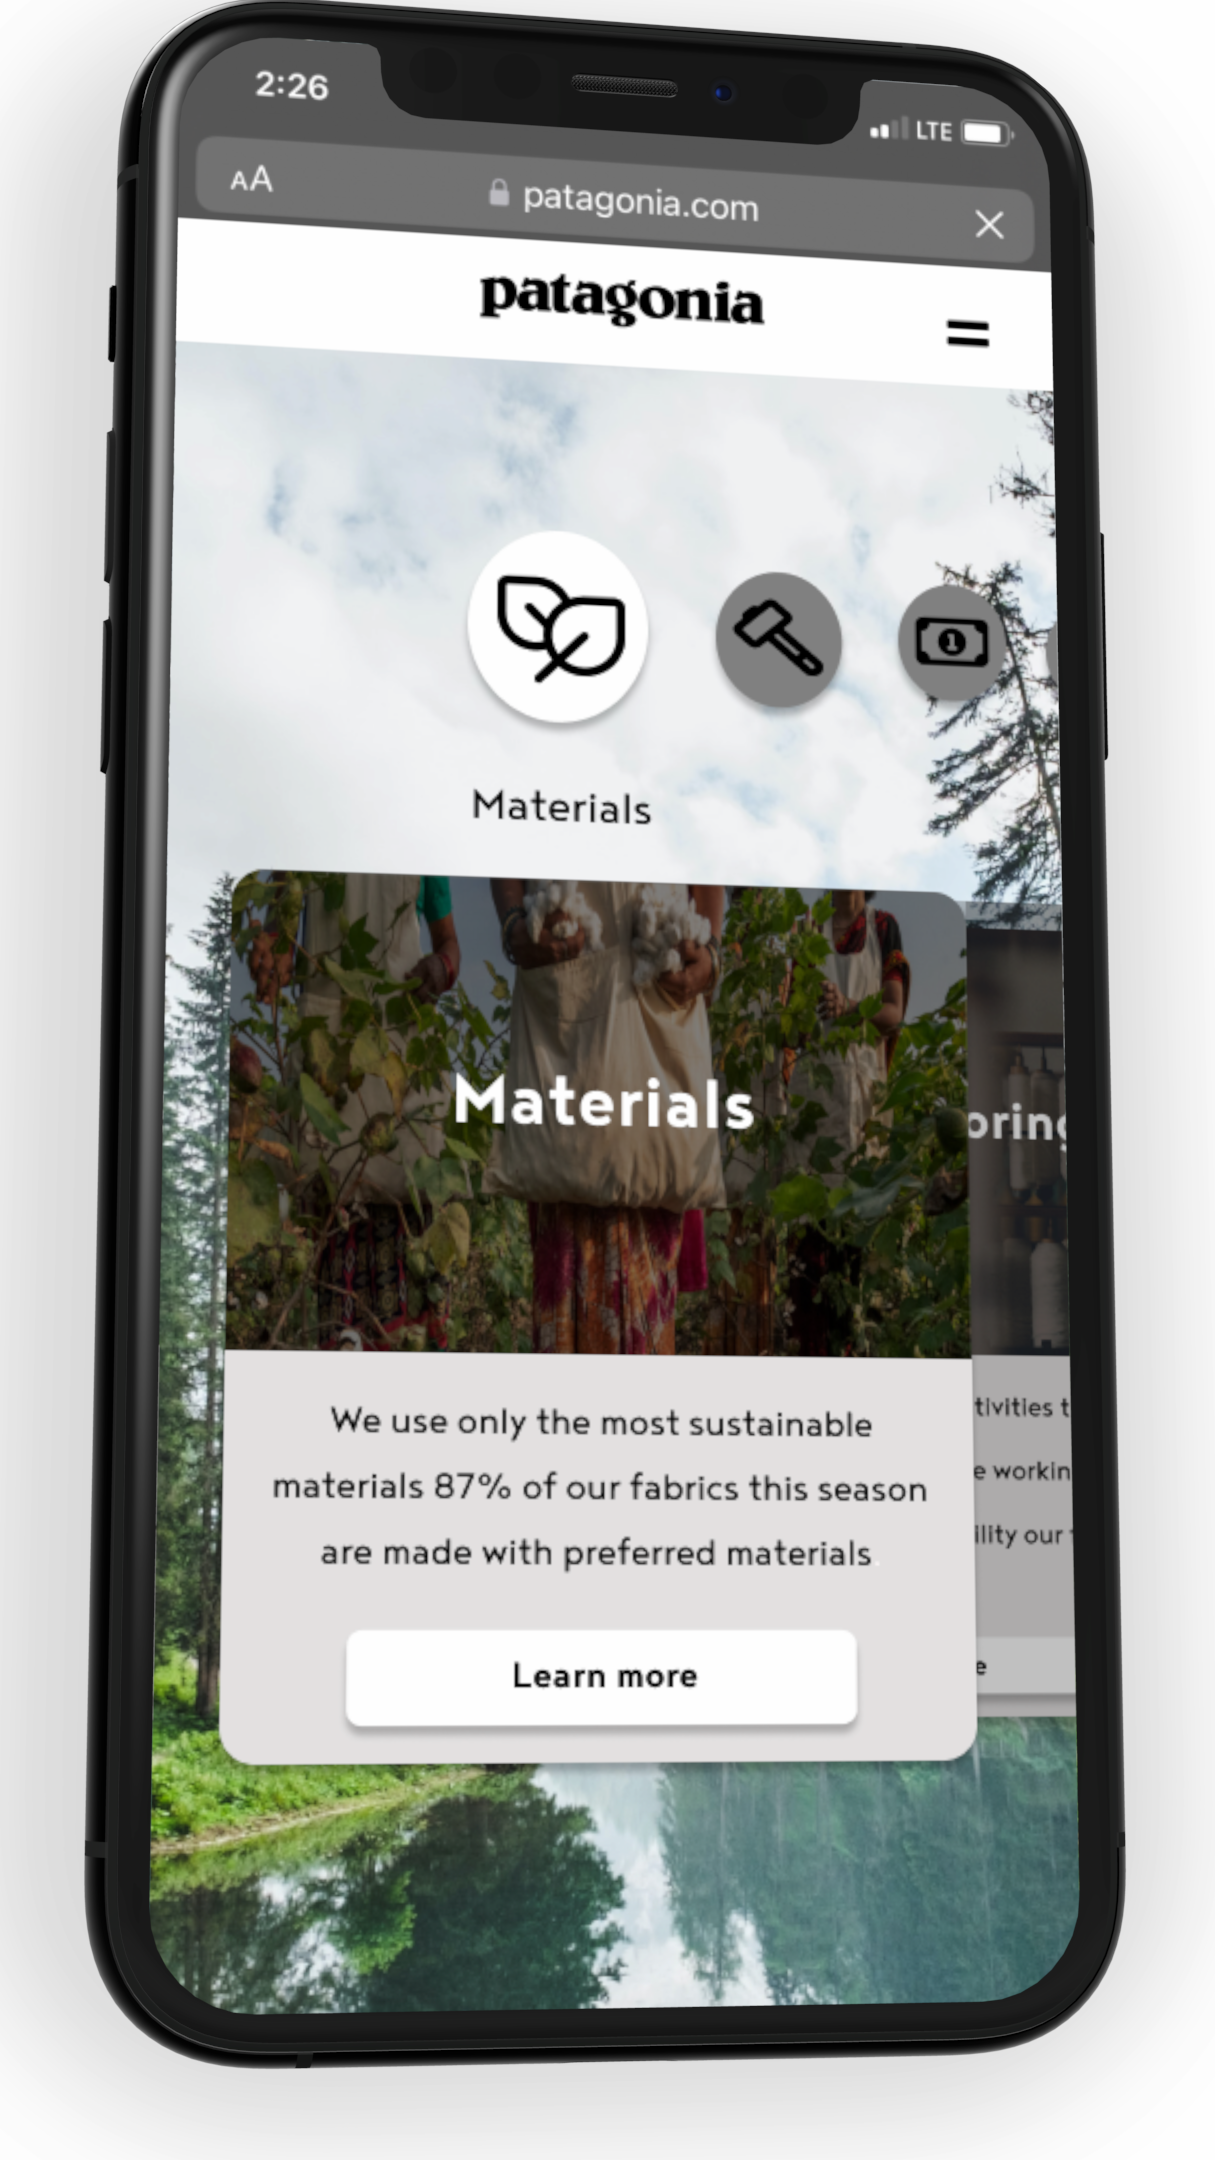
We looked at four companies’ websites to see how they displayed their sustainability data. We chose two companies we knew to have environmental missions: Patagonia & Girlfriend Collective and two companies we thought to be greenwashing: BP and L.A. Colors. We found 5 main ways companies display sustainability data on their sites:
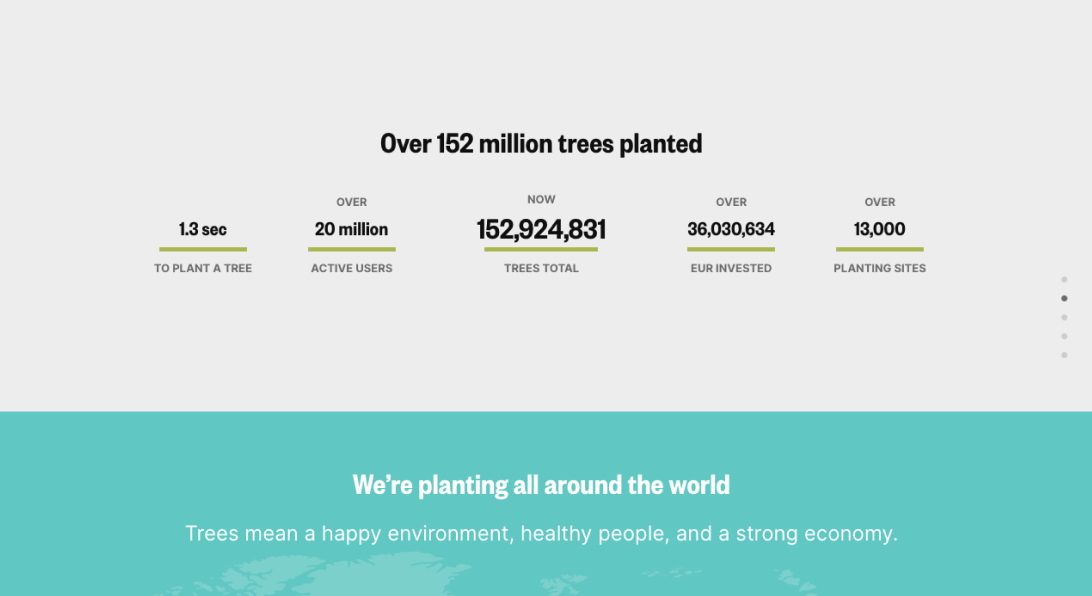
Photos documenting and providing evidence of sustainable practices
Links connecting the company to sustainable certifications
Sustainability plans
Articles about how they are being sustainable
Graphics showing sustainability projects
Exploratory Research

In order to get user thoughts on climate-conscious companies I created a user survey that included questions on general thoughts on sustainability, questions about users’ feelings about greenwashing, and included photos of different sustainability marketing strategies for users to rank based on user trust.
User Survey

My survey matched the found data that consumers are skeptical of companies claiming to be sustainable.
“Companies claim to be environmentally friendly when they are literally coal and oil companies.”
“It seems that all companies are trying to cash in on being eco-conscious”
I provided 9 examples of sustainability claims marketing and asked users “On a scale of 1-5 how much does this image make you trust that this company is sustainable?” and had them elaborate on why.
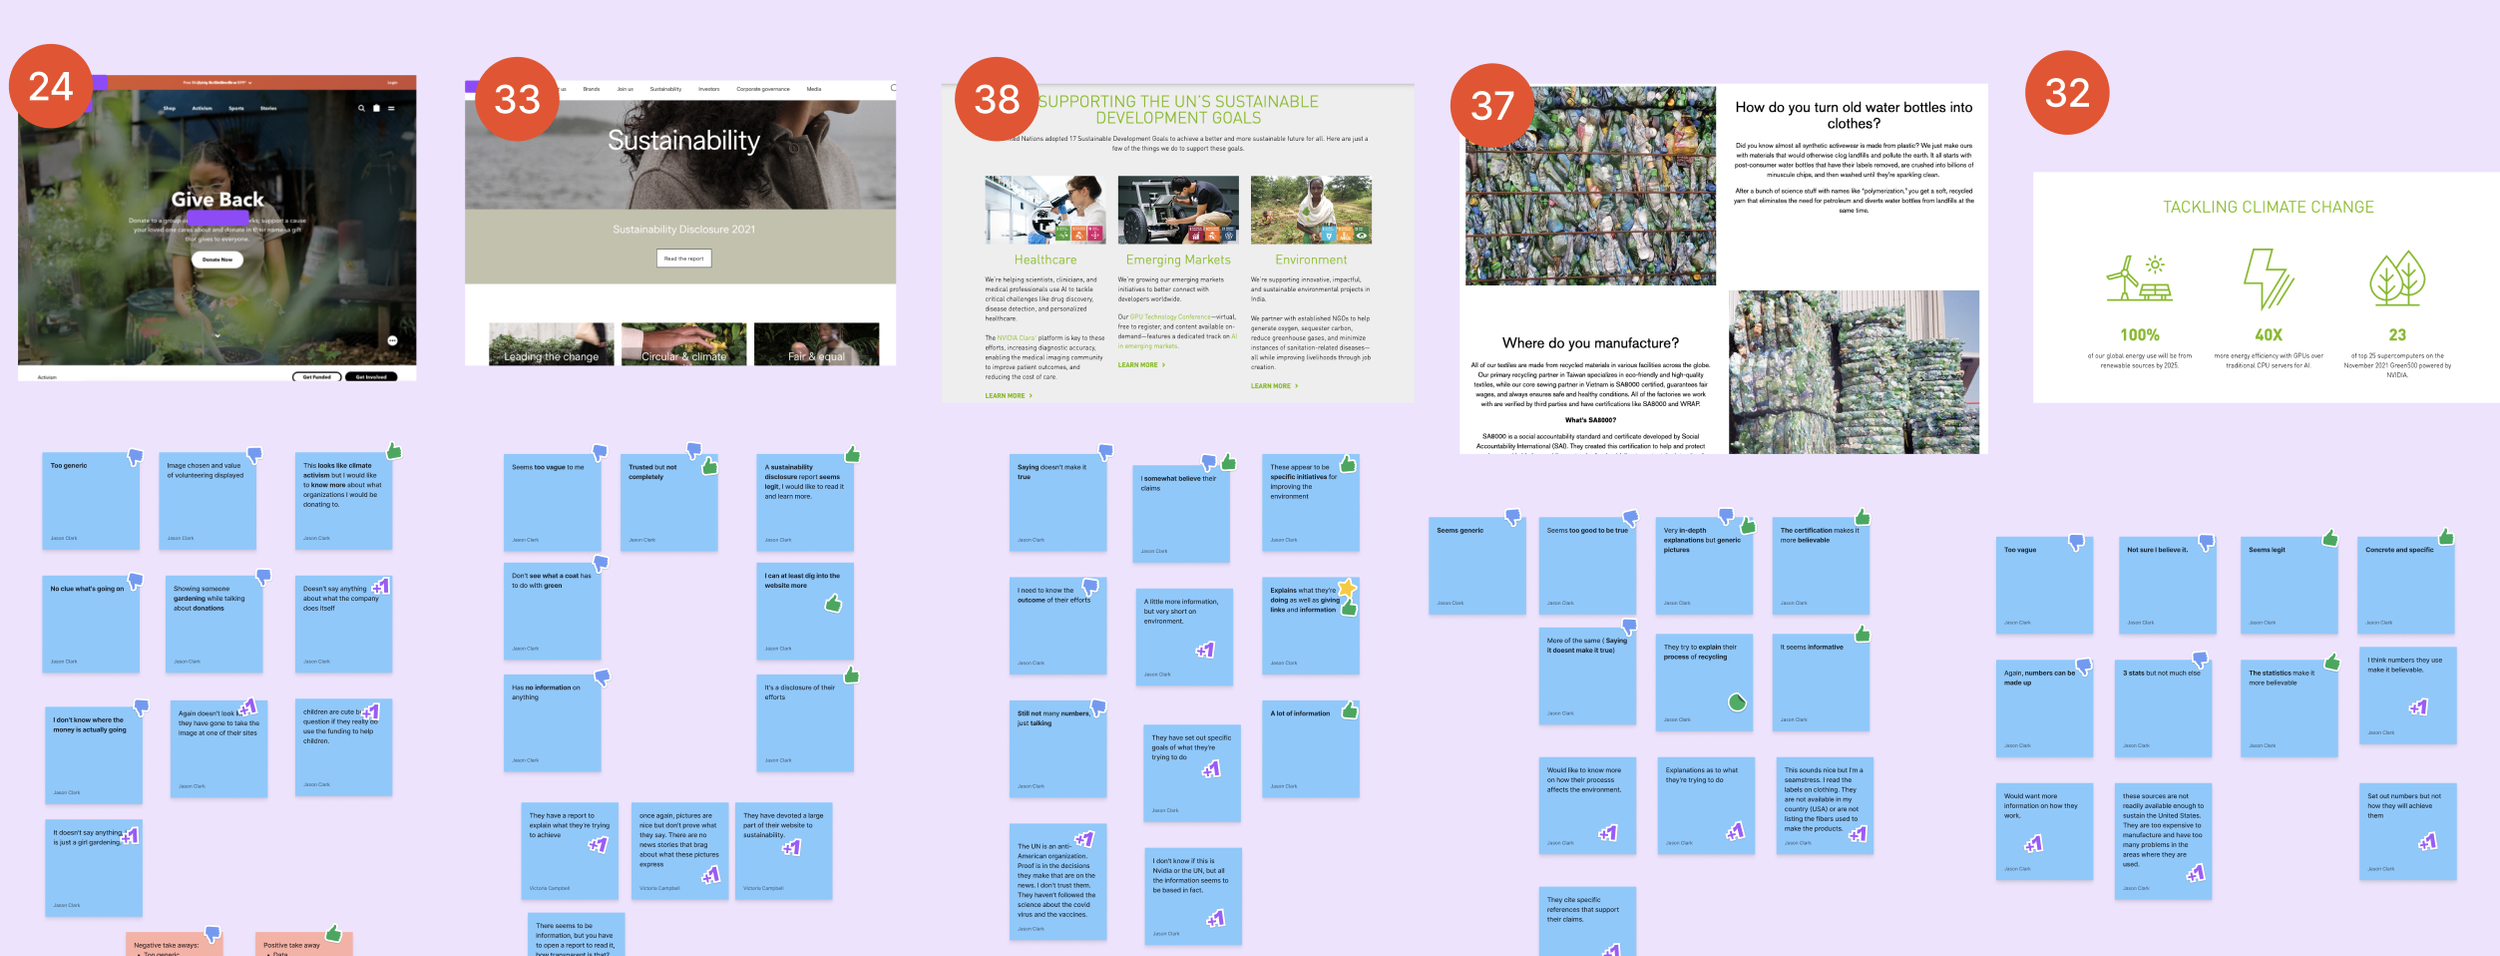
Participants in our survey rated trust HIGHER if the examples of sustainability marketing had:
Data with specific numbers & statistics
Links to certification or more in-depth info
Transparency
What are you doing, how are you doing it, how is it impacting the environment/others
Participants in our survey rated trust LOWER in examples of sustainability marketing if they had:
Vague Visuals
Generic photos
Generic Graphics
Lack of information
Numbers with no backup evidence to support
Although the survey yielded valuable insights, it was subject to certain limitations. Firstly, the data collection period was restricted to just one week, resulting in a relatively small sample size of only 11 participants. Additionally, to expedite the process, screenshots were used instead of presenting participants with full webpages, thereby omitting important contextual information. Despite these constraints, I am confident in the accuracy of the data, as the sample was diverse and the findings align with previous research on the topic.
Survey Limitations
Using the demographic data from our 11 survey participants, we created a persona of someone who would be interested in the environmental data of a company.
Persona

Persona Empathy Map
In order to get a better idea of what our target user may be feeling when they see companies environmental sustainability data on their website we gave Hannah the task of buying yoga pants.

Pain points
From this exercise, we learned that our target user could feel:
Uncertain if the company is being truthful
Guilty over not feeling like they want to pay that much for a sustainable product
Anxiety over buying something that may not have a good impact on the environment
Possible growth points
If a person feels more certain that their money is going towards a sustainable goal they will feel less guilty and more willing to spend money on the product.
We can reduce anxiety about supporting an environmentally sustainable company by showing legitimacy in a company's sustainability practices.
Research Main Take Aways
What can companies do to communicate their sustainability efforts effectively to their consumers?

Take the user on a journey
Providing full transparency on how the product is made and its impact from beginning to end made users feel more comfortable

Data = Trust
Specific numbers and data in context led to more trust. It was important to users that this data was easily digestible as users wanted to know the data was there, but didn’t necessarily want to read all of it.

The more specific the better
We saw an increase in trust when sustainability marketing had a lot of links to stories, data, certifications, and endorsements.

Beware of generic
Generic photos and data led to user distrust that the company was not actually doing what they said.
Ideation
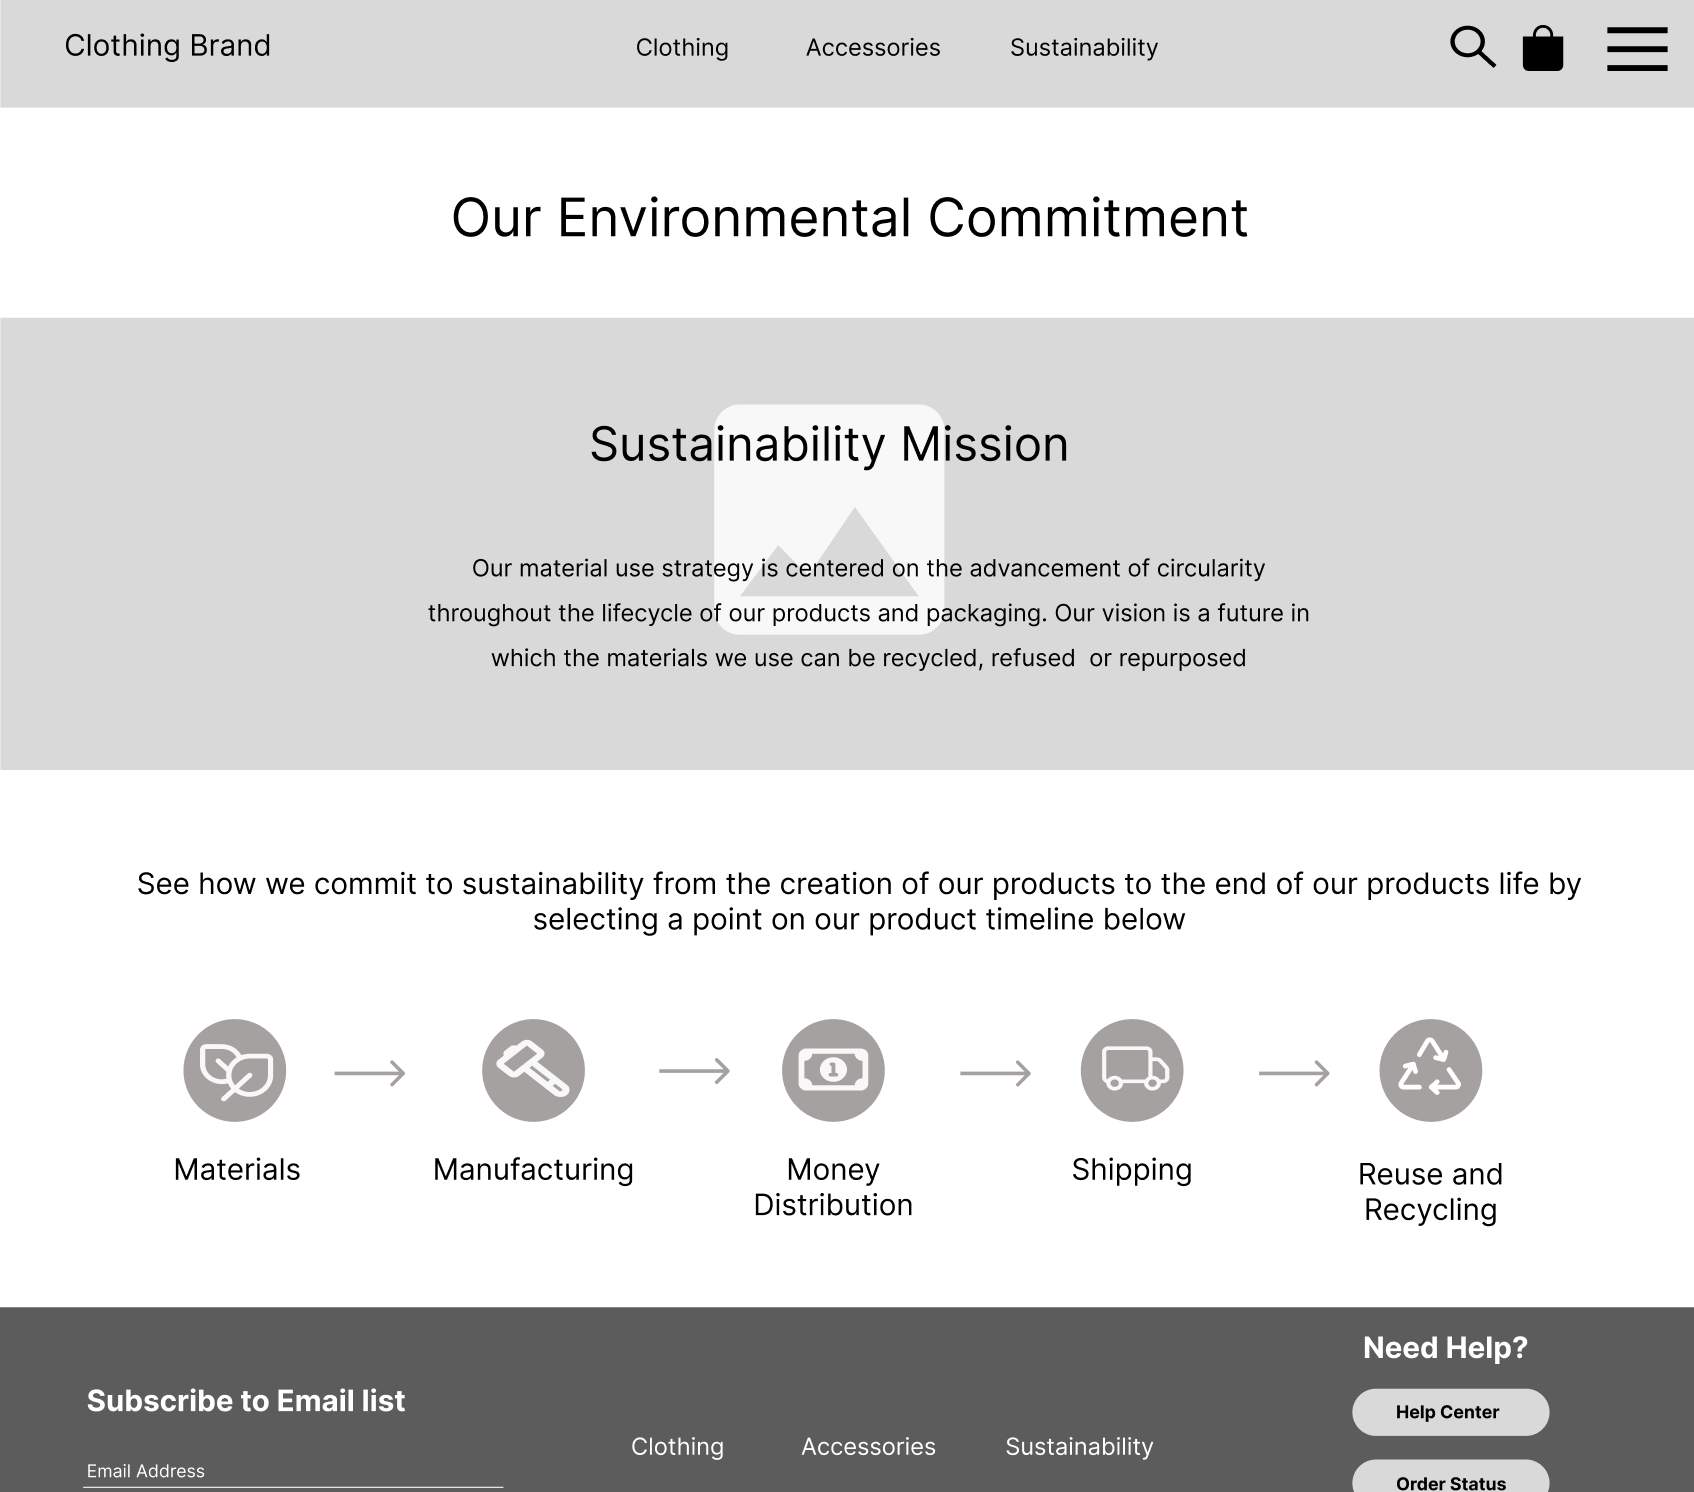
After brainstorming and sketching designs, it was determined that an interactive timeline where a user can see the sustainability story of a product from creation to the end of the lifecycle would be the most effective way to build trust. The timeline would provide transparent data, take a user on a journey, and provide context at each step of the process.
Brainstorming and Sketching
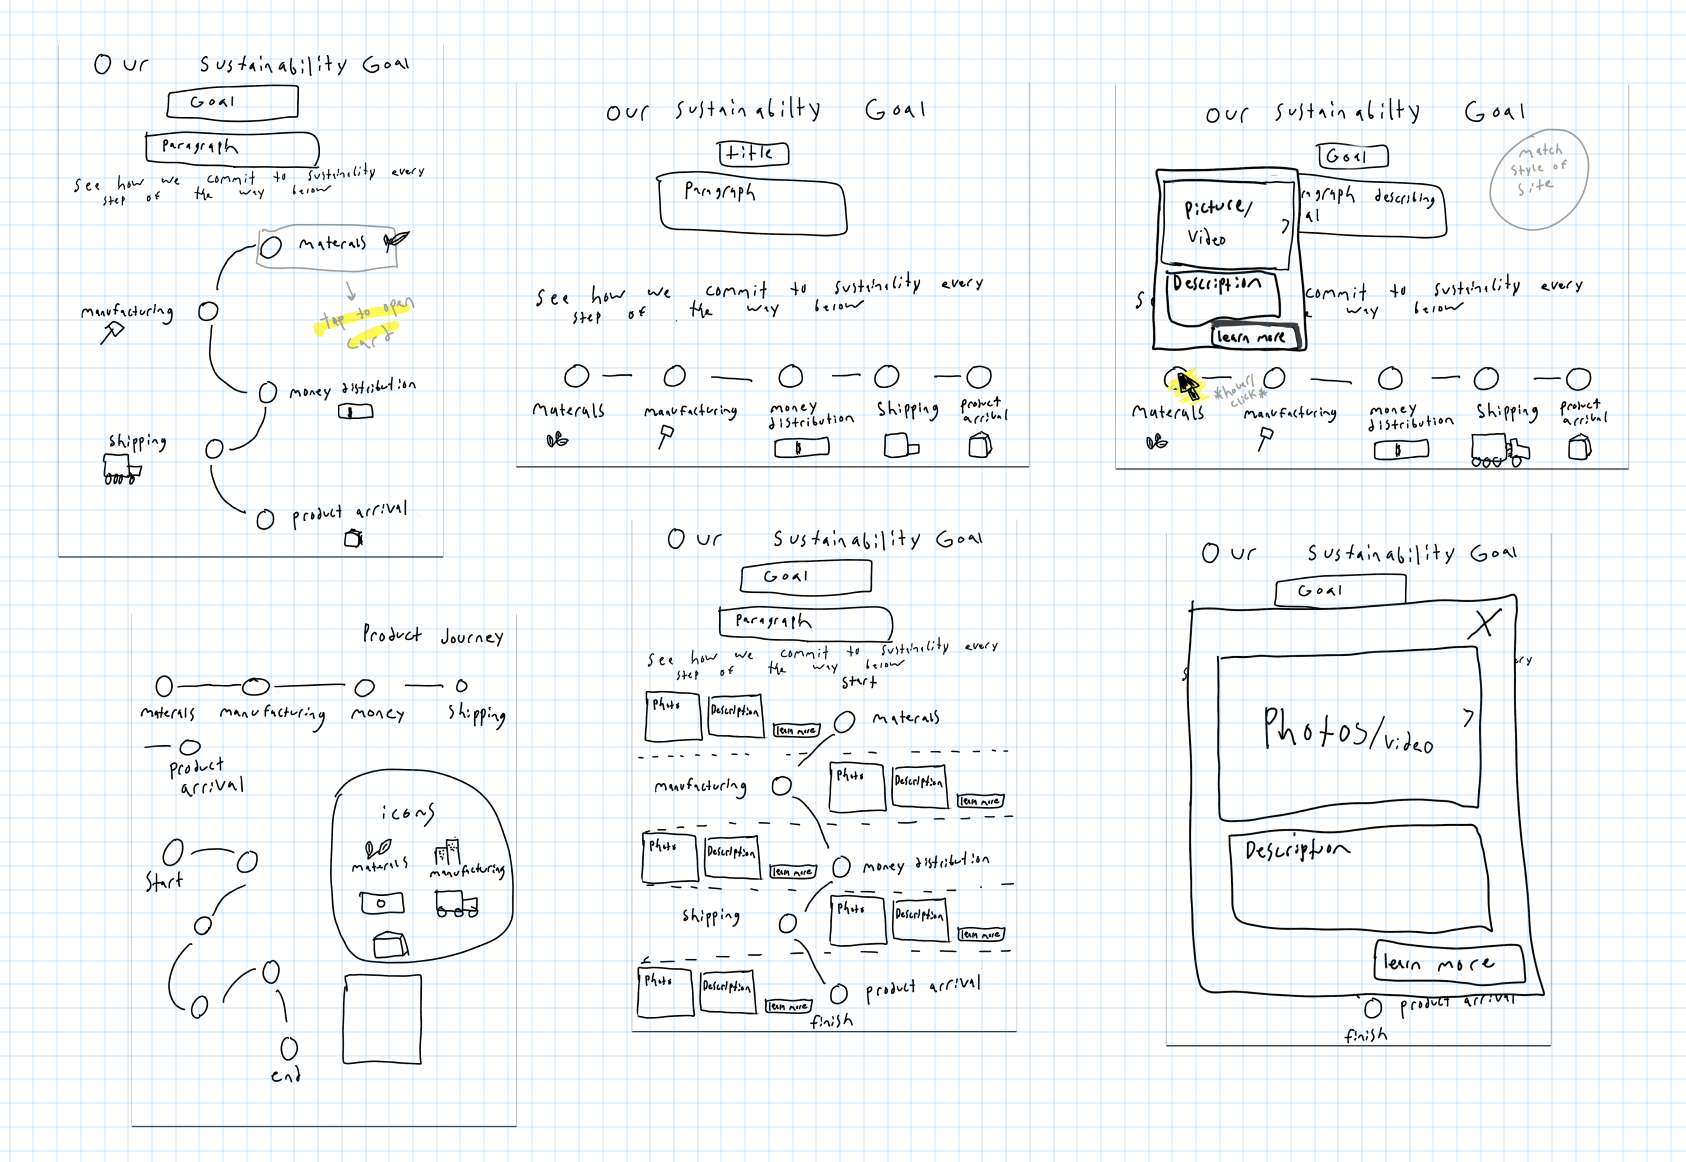
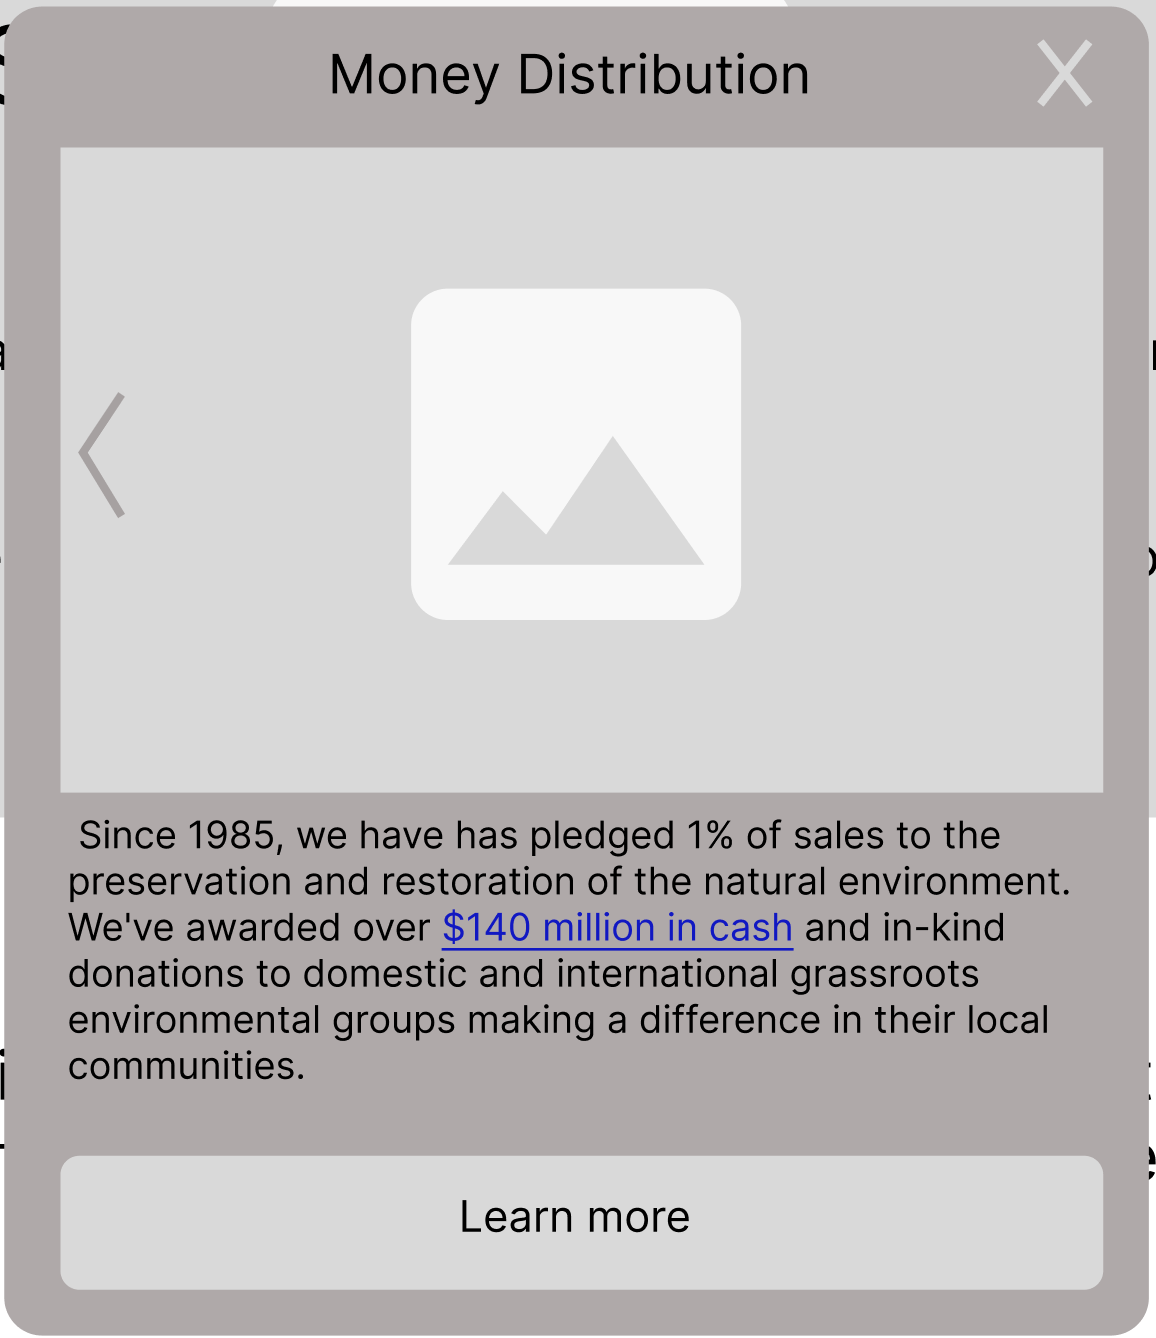
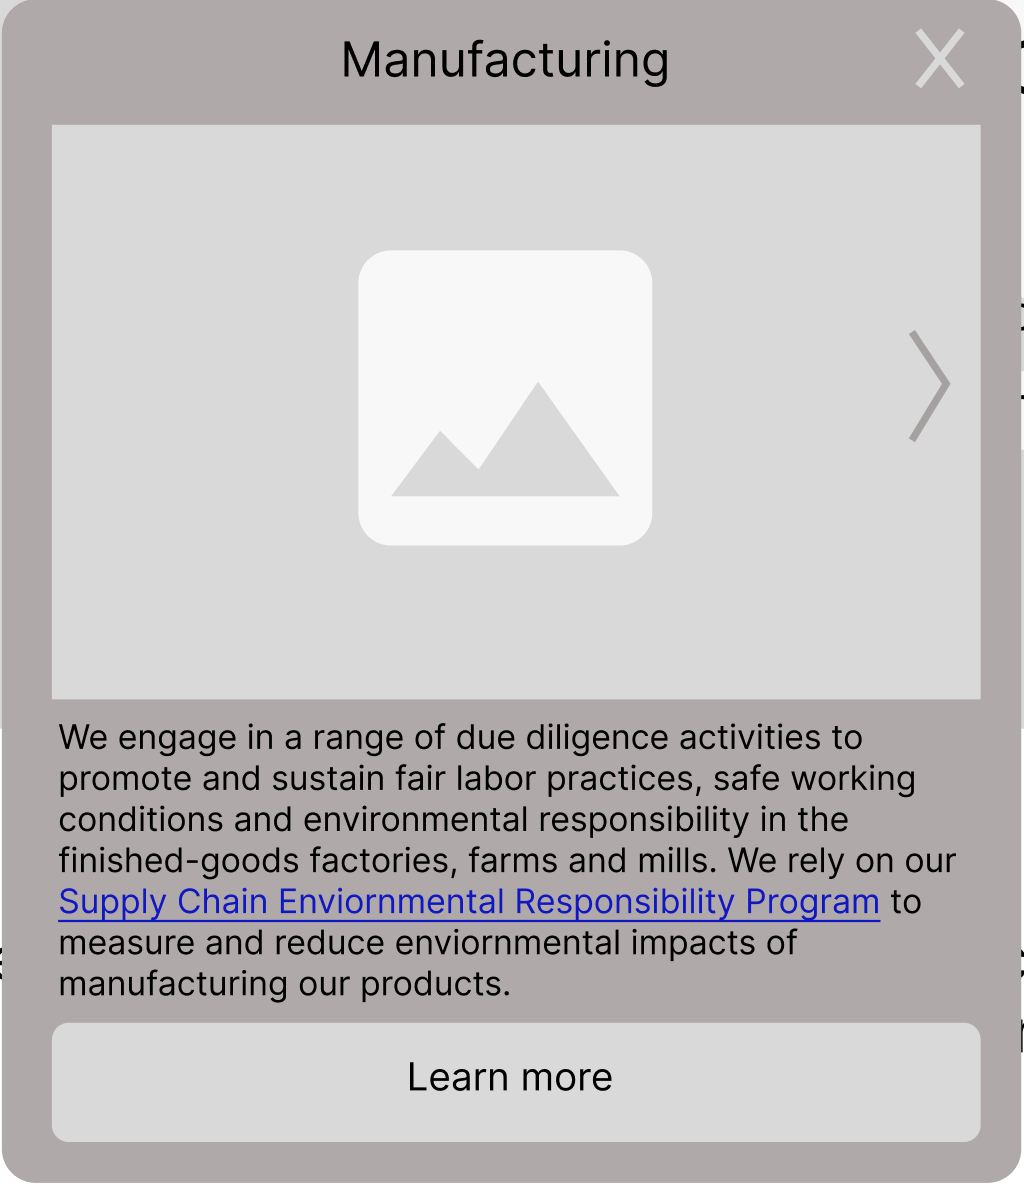
According to our research, users wanted to know all the sustainability information was available but did not necessarily want to read it. This prototype allows the user to see a shortened version of the data in card form and gives them the option to continue to read more in-depth info.
Mid-Fidelity Prototype
User Testing
The purpose of the usability test was to test whether users feel more trust in the company’s sustainability mission when they are shown the full environmental impact of a product's timeline.
I found that:
Users struggled to know what they could interact with on the main timeline page
Users wanted cards that were aesthetically pleasing and indicated better what users can interact with.
Users wanted a better navigation experience once they entered the learn more part of the site
Final Design
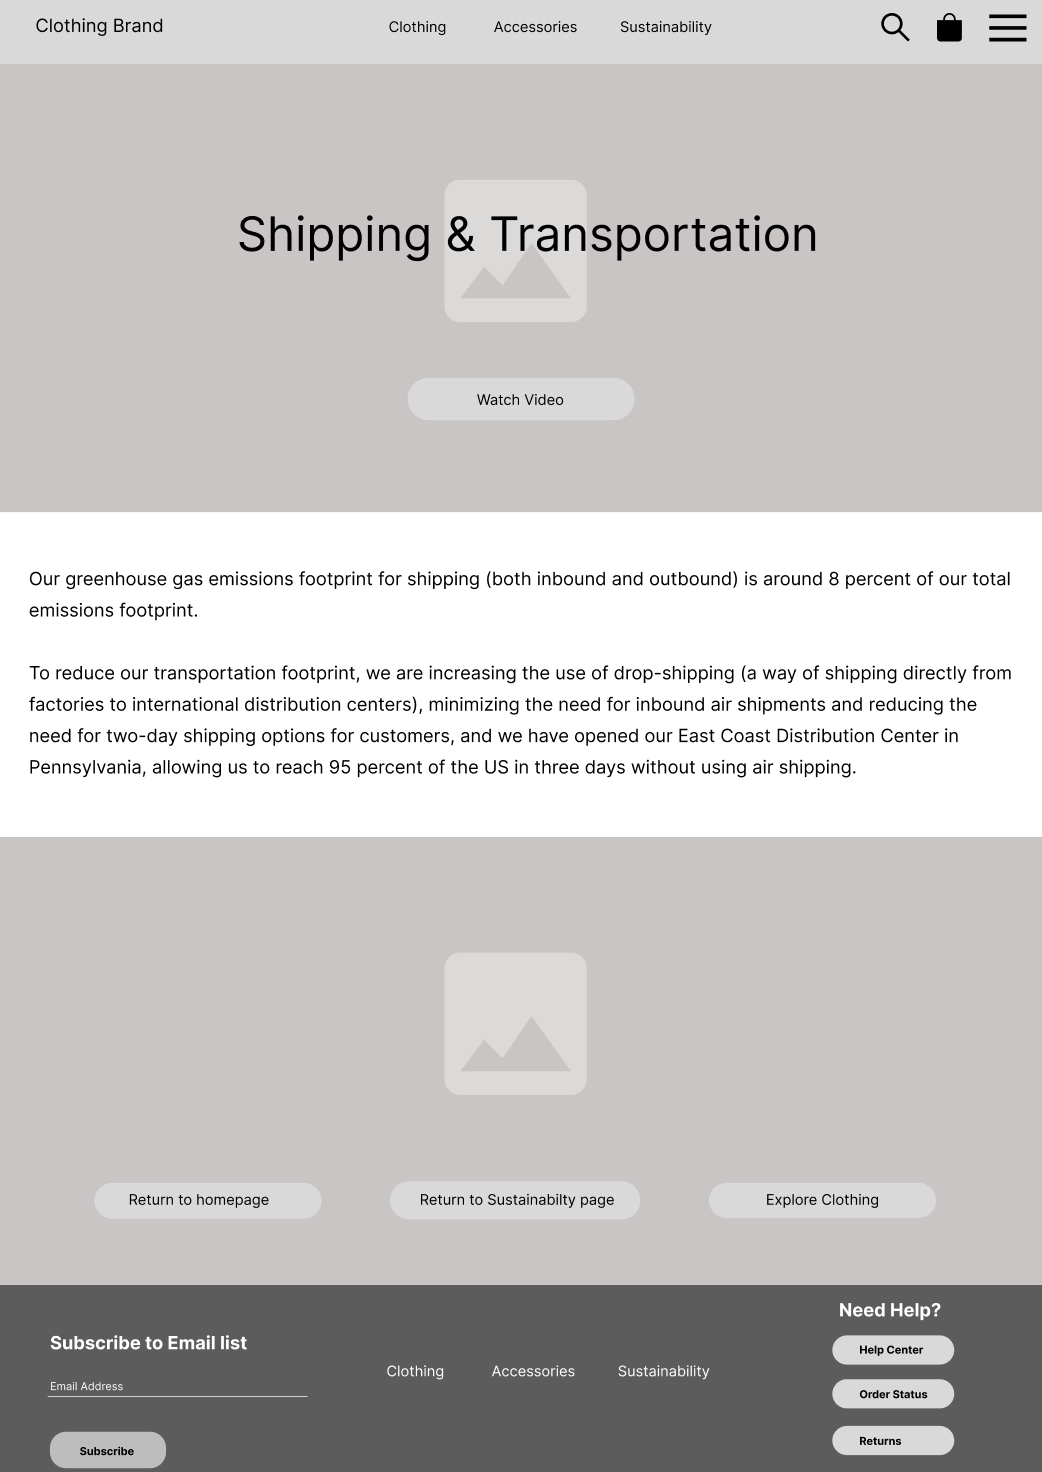
In my final design, I wanted to avoid information overload. I focused on how to condense large amounts of data in the designs that were still available to users if they wanted to explore the information in further detail.
This design meets the criteria for all of what we learned from our research:
It gives users a view of the product’s environmental impact starting from the materials the product is made from to how it can be recycled
Has links to outside sources to improve credibility
Has a condensed version of what the company is doing that doesn’t force users to have to read a lot of text but has the option to read more.


Future Steps
Adapt for Mobile
More design and testing work is needed to adapt the card timeline solution for mobile.
Ideally, this format could become an industry standard for displaying sustainability data because of its effectiveness in building trust in the brand. It would be interesting to explore how other compani’s data will fit into this format.
Standardize Template for Wider Use
See More
Research & design a feature for customers to divide payments with others ↗
Research how Monday.com might improve the ease of use and reduce the learning curve of their platform. ↗
Increasing Intakes for a Mental Health Private Practice by 320%↗